Learning Grap
Sun, 27 Aug 2023 13:08:59 -0500
Grap is a simple preprocessor that allows you to typeset graphs in groff using the ms macros. It is a neat little tool that allows you to make fairly advanced graphs for PDF, PS, and HTML documents. As an exercise, I've been using it to typeset my statistics notes.
Basic syntax
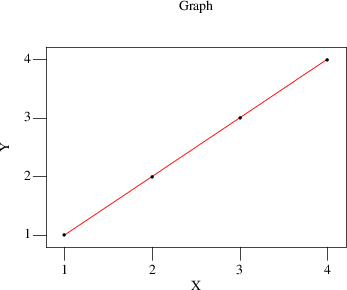
When using grap, we place all of the commands use to generate a new graph using the .G1 tag to open the environment and .G2 to close it. Below is an example of a very simple scatter plot.
.G1
label top "Graph"
label bottom "X"
label left "Y"
line solid from 1,1 to 4,4 color "red"
1 1
2 2
3 3
4 4
.G2
Let's breakdown these commands to better understand what's going on:
- label [top,bottom,left,right] "Content" The label command allows you to specify a simple label for your graph. You can place them on the top, bottom, x-axis, or y-axis.
- line [solid,dotted,dashed] from x,y to x,y The line command allows you to draw a simple line starting at one point and going to another. Notice that you need to separate your points with a comma.
- x y The numbers separated by a space is the data for. It is important to note that when you are typing in data, they must be delimited with a one or more spaces. Commas, semi-colons, and other common delimiters will cause an error.
These basic commands will out put the following chart.

Another nice feature of grap is that we can source data from an external text file. This way, if we have a lot of data points, we can organize them in a separate file/directory. We use the copy command to import a data file. Here is a example:
.G1
label top "Graph"
label bottom "X"
label left "Y"
line from 1,1 to 4,4 color "red"
copy "/path/to/file.dat"
.G2
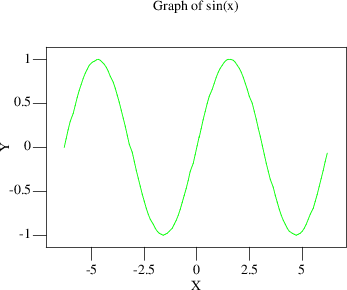
It is also possible to plot more sophisticated functions as well such as sin and cos. Below is an example taken from the grap documentation on how to graph sin(x) on the interval [-2π,2π].
.G1
label top "Graph of sin(x)"
label bottom "X"
label left "Y"
draw solid color "green"
pi = atan(0,-1)
for i from -2*pi to 2*pi by 0.1 do { next at i, sin(i); }
.G2
Put in English, we are running a for loop over the domain [-2π,2π] by steps of 0.1 and plotting the output. Notice that we've defined a constant pi for π with a clever use of the atan2 (arctan) function. This markup will result in following graph.

If you want more examples, grap comes with a ms file full of common examples including histograms, box and whisker plots, time series plots, and many other common graphs you can create with grap. Just call the graph help command in your terminal command, and grap will tell you where the example files are installed on your system:
$ grap --helpCompiling a Document With Grap
Like all groff preprocessors, grap is a standalone program whose output can be piped into groff. Also like all groff preprocessors, groff has a nice flag that allows you compile any groff document with grap. Suppose that our document is called test.ms. We would compile it as follows:
$ groff -G -ms test.ms -Tpdf > test.pdfConcluding Remarks
I've been looking for a replacement for RMarkdown for some time now, and I think grap is a great replacement for simple graphs. If you've ever used RMarkdown, you might be wondering why I would use a more "difficult" solution for making graphs. I will concede that it takes more leg work to get used to grap, but using groff in tandem with grap runs much more quickly on my system than having to compile documents with RMarkdown. RMarkdown uses a LaTeX engine, markdown, and a whole bunch of other programs to compile what are fairly simple documents. It's not at all minimal. I understand that for more sophisticated data visualization, grap can become tedious and impractical, but for the simple stuff, I prefer its minimalist aesthetic and quick compiling.
I will note that I still use the R programming language to generate my data, but I output the data in a format that grap can use. Then I write my reports using groff and grap.
Resources
- Grap Examples
- vim /usr/share/examples/grap
- man grap